Slicing multi-dimensional data cubes
How to slice data cubes
APLpy supports extracting a slice from n-dimensional FITS cubes, and
re-ordering dimensions. The two key arguments to
FITSFigure to control this are dimensions and
slices. These arguments can also be passed to show_contour().
The dimensions argument is used to specify which dimensions should be used
for the x- and y-axis respectively (zero based). The default values are [0,
1] which means that the x-axis should use the first dimension in the FITS
cube, and the y-axis should use the second dimension. For a 2-dimensional FITS
file, this means that one can use [1, 0] to flip the axes. For a FITS cube
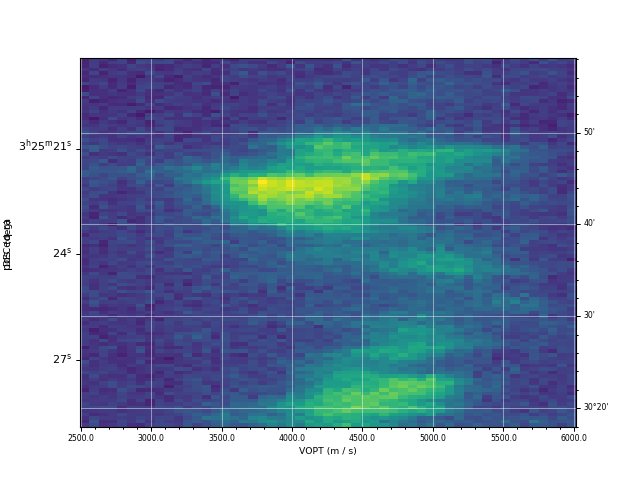
with R.A., Declination, and Velocity, [0, 2] would make a R.A.-Velocity
plot.
The slices argument gives the pixels slice to extract from the remaining
dimensions, skipping the dimensions used, so slices should be a list with
length n-2 where n is the number of dimensions in the FITS file. For example,
if one has a FITS file with R.A., Declination, Velocity, and Time (in that
order), then:
dimensions=[0, 1]means the plot will be an R.A-Declination plot, andslices=[33, 56]means that pixel slices 33 and 56 will be used in Velocity and Time respectively (in this case,dimensionsdoes not need to be specified since it defaults to[0, 1])dimensions=[0, 2]means the plot will be an R.A-Velocity plot, andslices=[22, 56]means that pixel slices 22 and 56 will be used in Declination and Time respectively.dimensions=[3, 2]means the plot will be a Time-Velocity plot, andslices=[10, 22]means that pixel slices 10 and 22 will be used in R.A and Declination respectively.
See Arbitrary coordinate systems for information on formatting the labels when non-longitude/latitude coordinates are used.
Aspect ratio
When plotting images in sky coordinates, APLpy makes pixel square by default,
but it is possible to change this. When calling
show_grayscale() or
show_colorscale(), simply add aspect='auto'
which will override the aspect='equal' default. The aspect='auto' is
demonstrated below.
Example
The following examples demonstrates this functionality in use
from astropy.utils.data import get_pkg_data_filename
co_cube = get_pkg_data_filename('l1448/l1448_13co.fits')
import aplpy
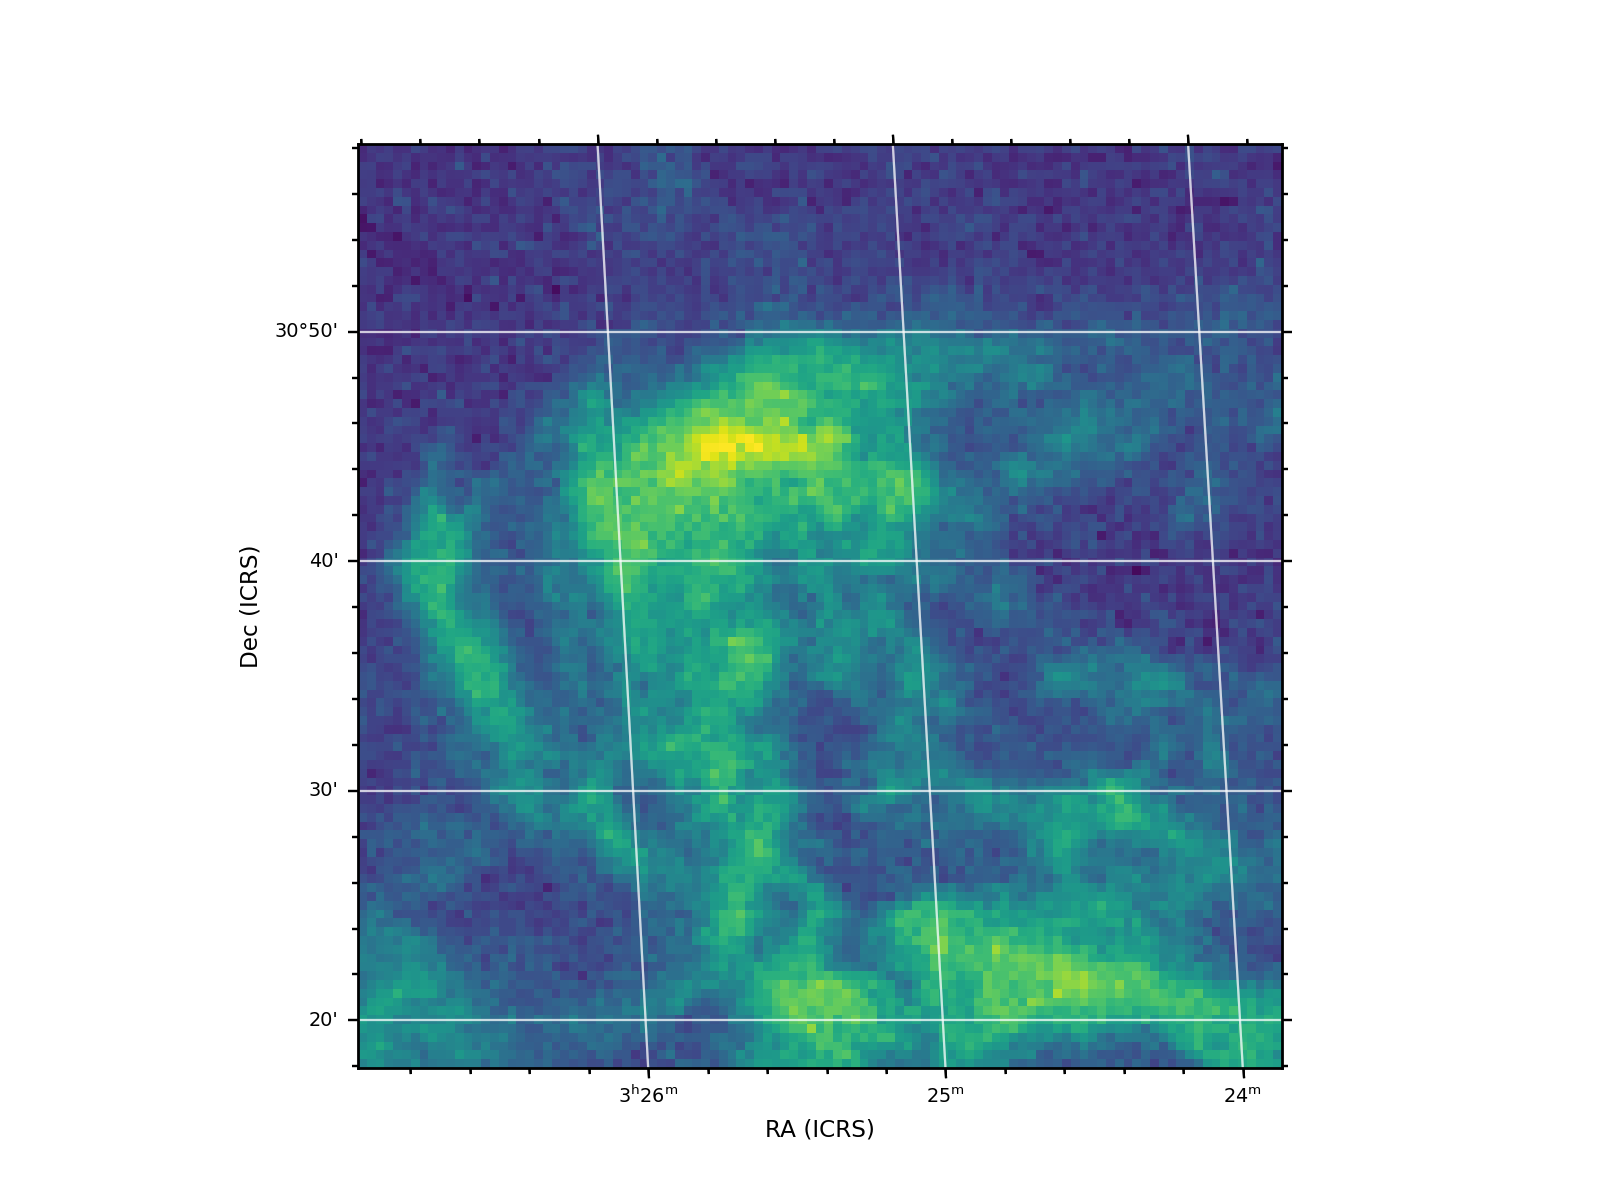
f = aplpy.FITSFigure(co_cube, slices=[30], figsize=(8, 6))
f.show_colorscale()
f.add_grid()
f.tick_labels.set_font(size='x-small')
f.axis_labels.set_font(size='small')
(Source code, png, hires.png, pdf)

from astropy.utils.data import get_pkg_data_filename
co_cube = get_pkg_data_filename('l1448/l1448_13co.fits')
import aplpy
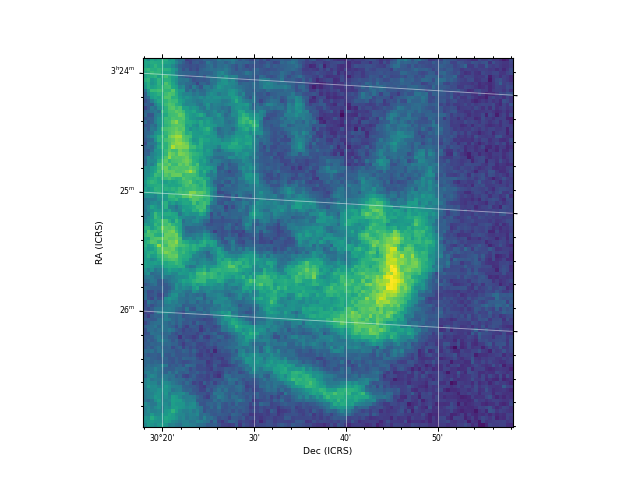
f = aplpy.FITSFigure(co_cube, slices=[30],
dimensions=[1, 0], figsize=(8, 6))
f.show_colorscale()
f.add_grid()
f.tick_labels.set_font(size='x-small')
f.axis_labels.set_font(size='small')
(Source code, png, hires.png, pdf)

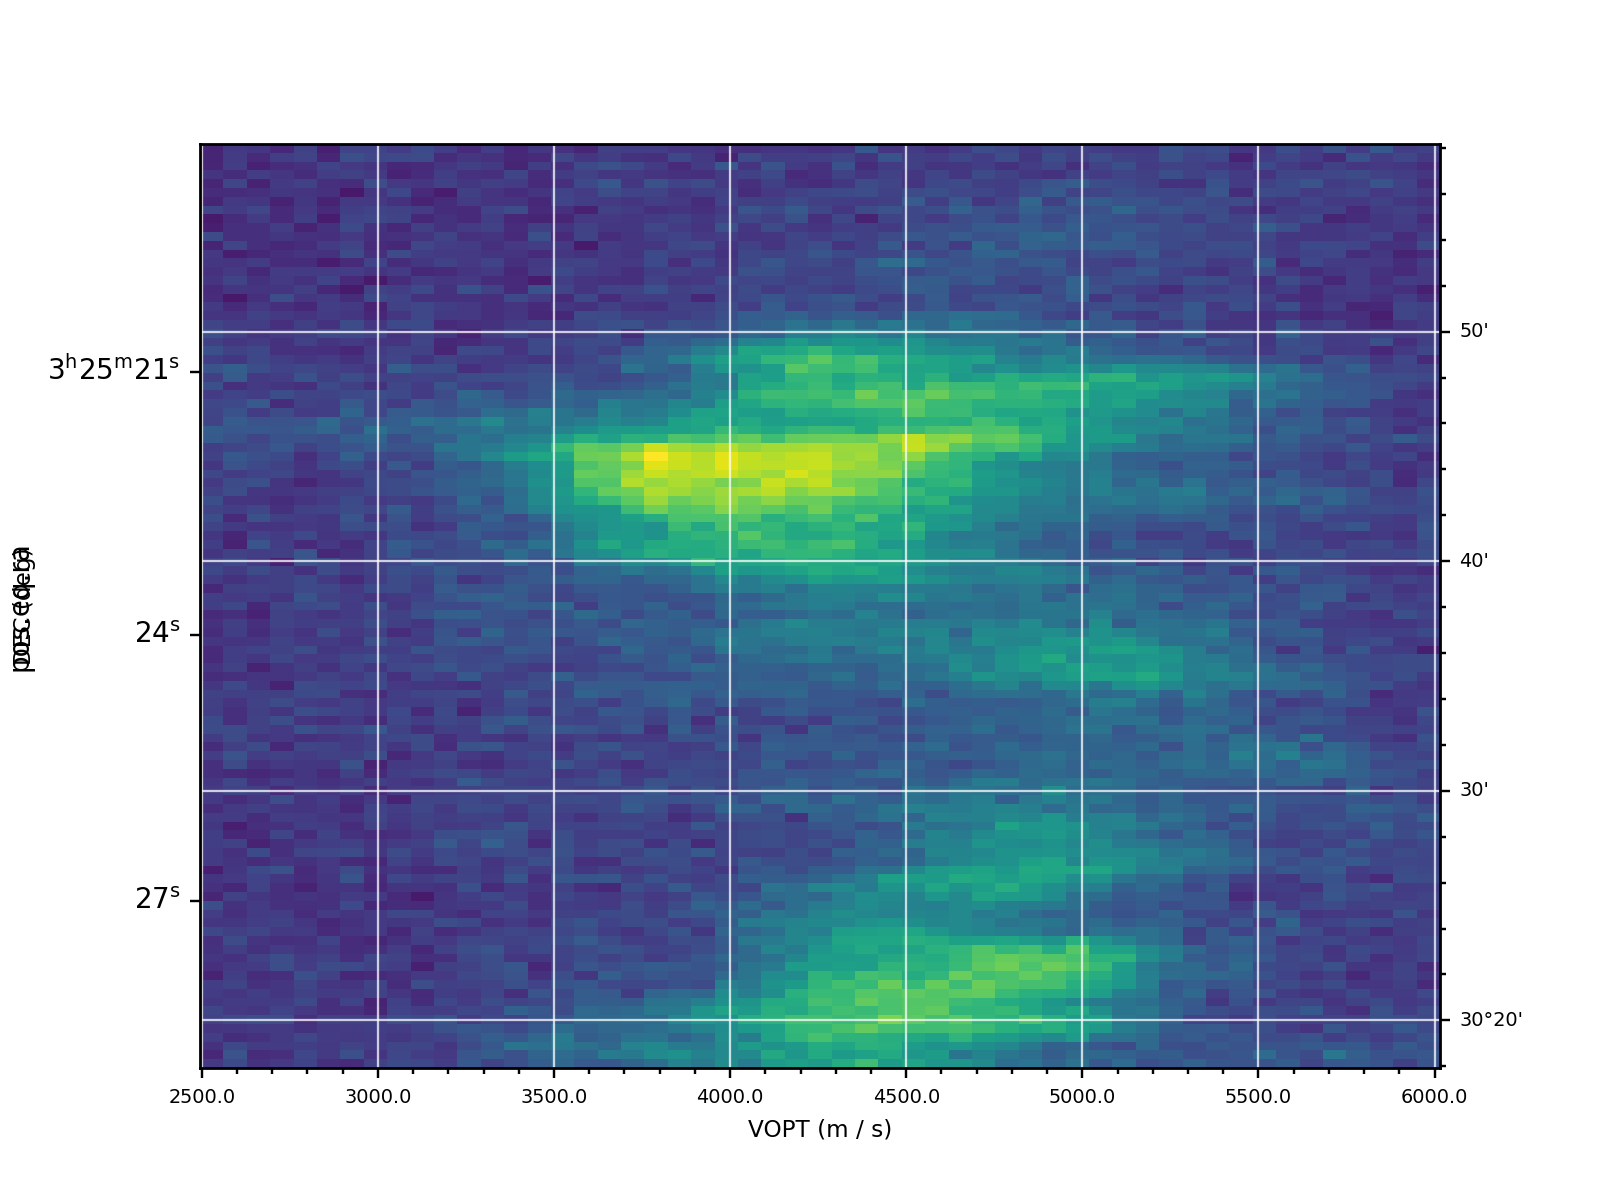
from astropy.utils.data import get_pkg_data_filename
co_cube = get_pkg_data_filename('l1448/l1448_13co.fits')
import aplpy
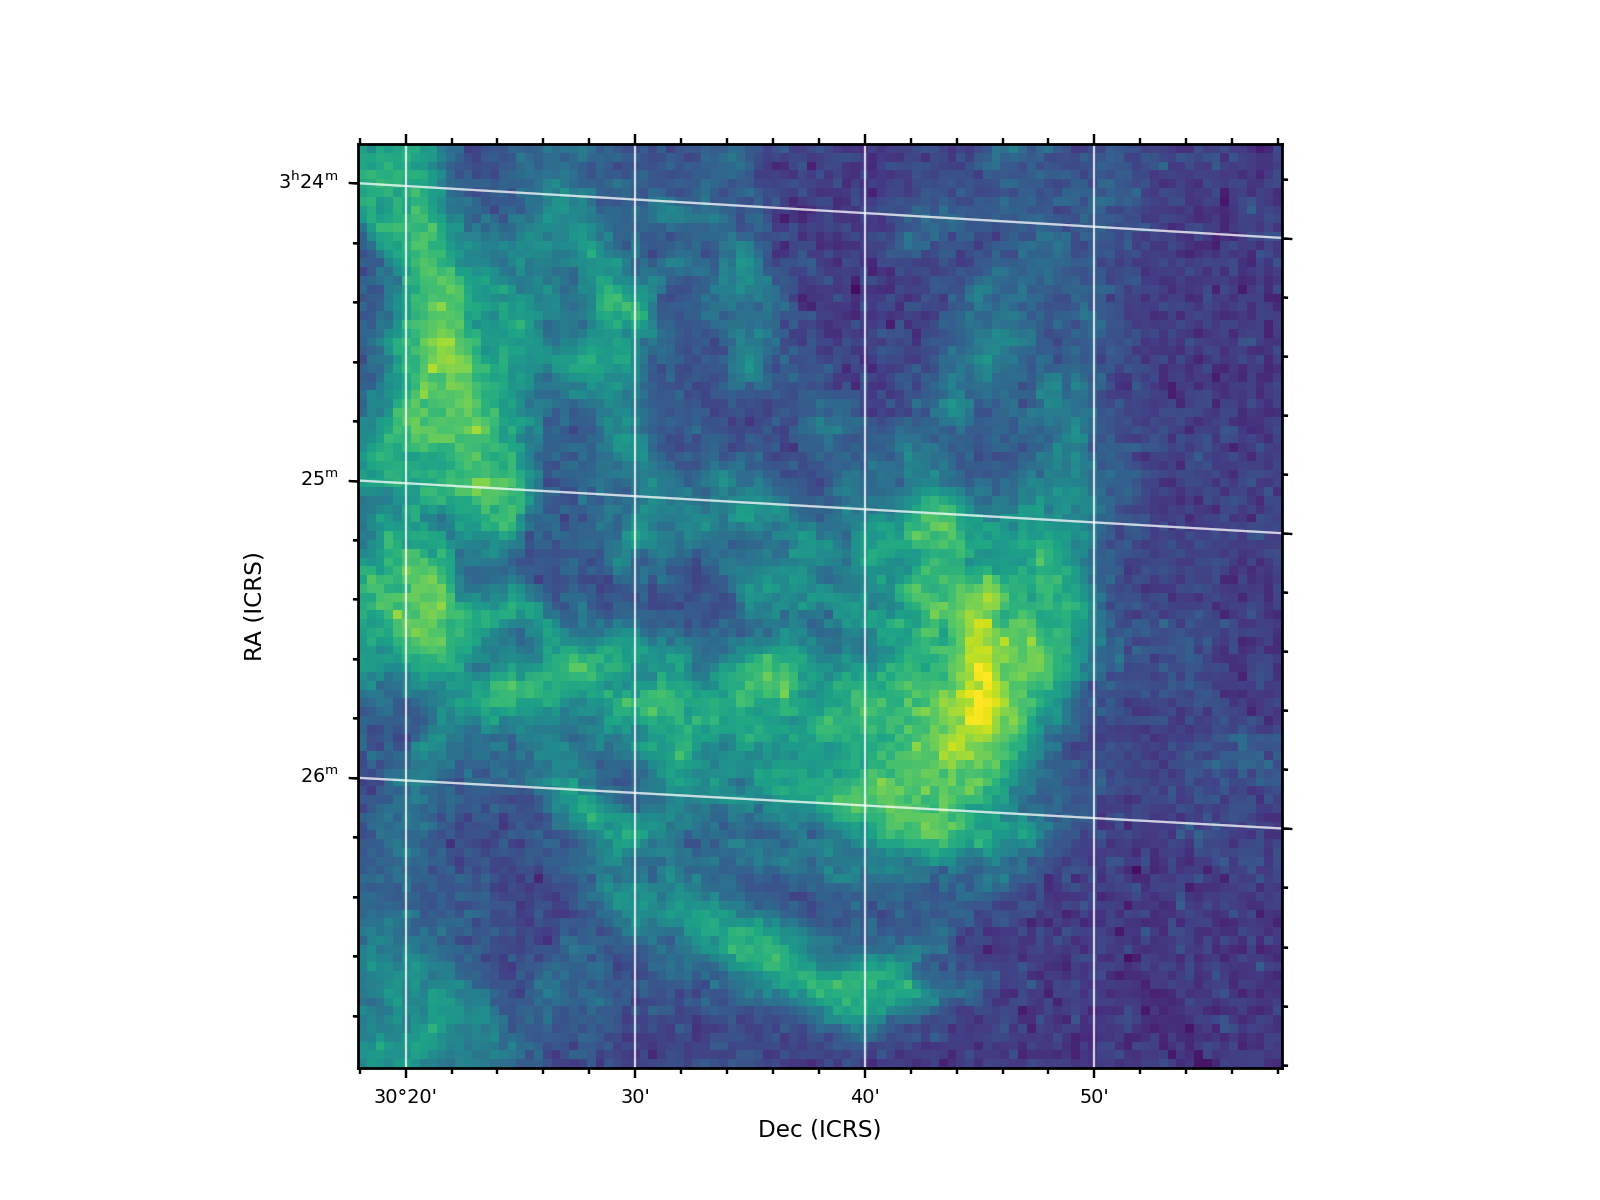
f = aplpy.FITSFigure(co_cube, dimensions=[2, 1],
slices=[50], figsize=(8, 6))
f.show_colorscale(aspect='auto')
f.add_grid()
f.tick_labels.set_font(size='x-small')
f.axis_labels.set_font(size='small')
f.tick_labels.set_xformat('%.1f')
(Source code, png, hires.png, pdf)
